Scheduled Tasks
- Issues caught before users notice — proactive monitoring replaces reactive dashboards
- Correlated insights instead of raw metrics — your agent reasons across data sources
- Describe checks in natural language — no scripts to write or maintain
- Create, edit, and manage tasks from the portal or chat
The problem
Operational tasks repeat. Every morning someone checks resource health. Every Monday someone pulls cost data. Every hour someone scans for anomalies. These repetitive tasks consume your team's time with predictable, automatable work — time better spent investigating real issues.
Traditional monitoring compounds the problem. Alert rules fire after a threshold is breached — by the time you see it, users are already affected. Dashboards show raw data but don't explain what it means. Each alert is isolated: your CPU alert doesn't know about the deployment that happened ten minutes ago. You correlate manually, across tools, every single time.
How scheduled tasks work
Your agent runs tasks on a schedule you define. Describe what you want done in natural language, set the frequency, and your agent handles execution automatically. Each execution creates a conversation thread where the agent plans its approach, queries data sources, reasons about findings, and produces an actionable summary.
This isn't a cron job running a script. Your agent uses its connectors, tools, knowledge, and memory to understand context. It notices that error rates are trending up 15% day-over-day even though they haven't hit the alerting threshold. It catches that storage usage will hit quota in three days at the current growth rate. It connects yesterday's deployment to today's exceptions.
Select Scheduled tasks in the left sidebar to manage all your tasks.
What makes this different
| Alert rules | Dashboards | Cron jobs | Scheduled tasks | |
|---|---|---|---|---|
| When | After threshold breached | When you look | On schedule | On your schedule, before thresholds |
| What it shows | Single metric | Raw data | Script output | Correlated findings with explanation |
| Context | None | Whatever you configured | What the script queries | Cross-source, compared to baseline |
| Action | You investigate | You investigate | Whatever the script does | Summary with recommended next steps |
| Adapts | Static rules | Static views | Static scripts | Memory captures patterns over time |
Unlike cron jobs, your agent understands natural language. You don't write scripts — you describe what needs to happen. Unlike runbooks, scheduled tasks execute automatically with the autonomy level you choose.
Before and after
| Before | After |
|---|---|
| Check dashboards manually every morning | Agent checks proactively and posts summary |
| Correlate alerts across tools by hand | Agent correlates across all connected sources |
| Issues discovered after users report them | Trends caught before they become incidents |
| Write and maintain monitoring scripts | Describe checks in natural language |
| Each team member checks differently | Consistent automated checks every time |
| Need to change a task? Delete and recreate | Edit any task in place — execution history preserved |
Task dashboard
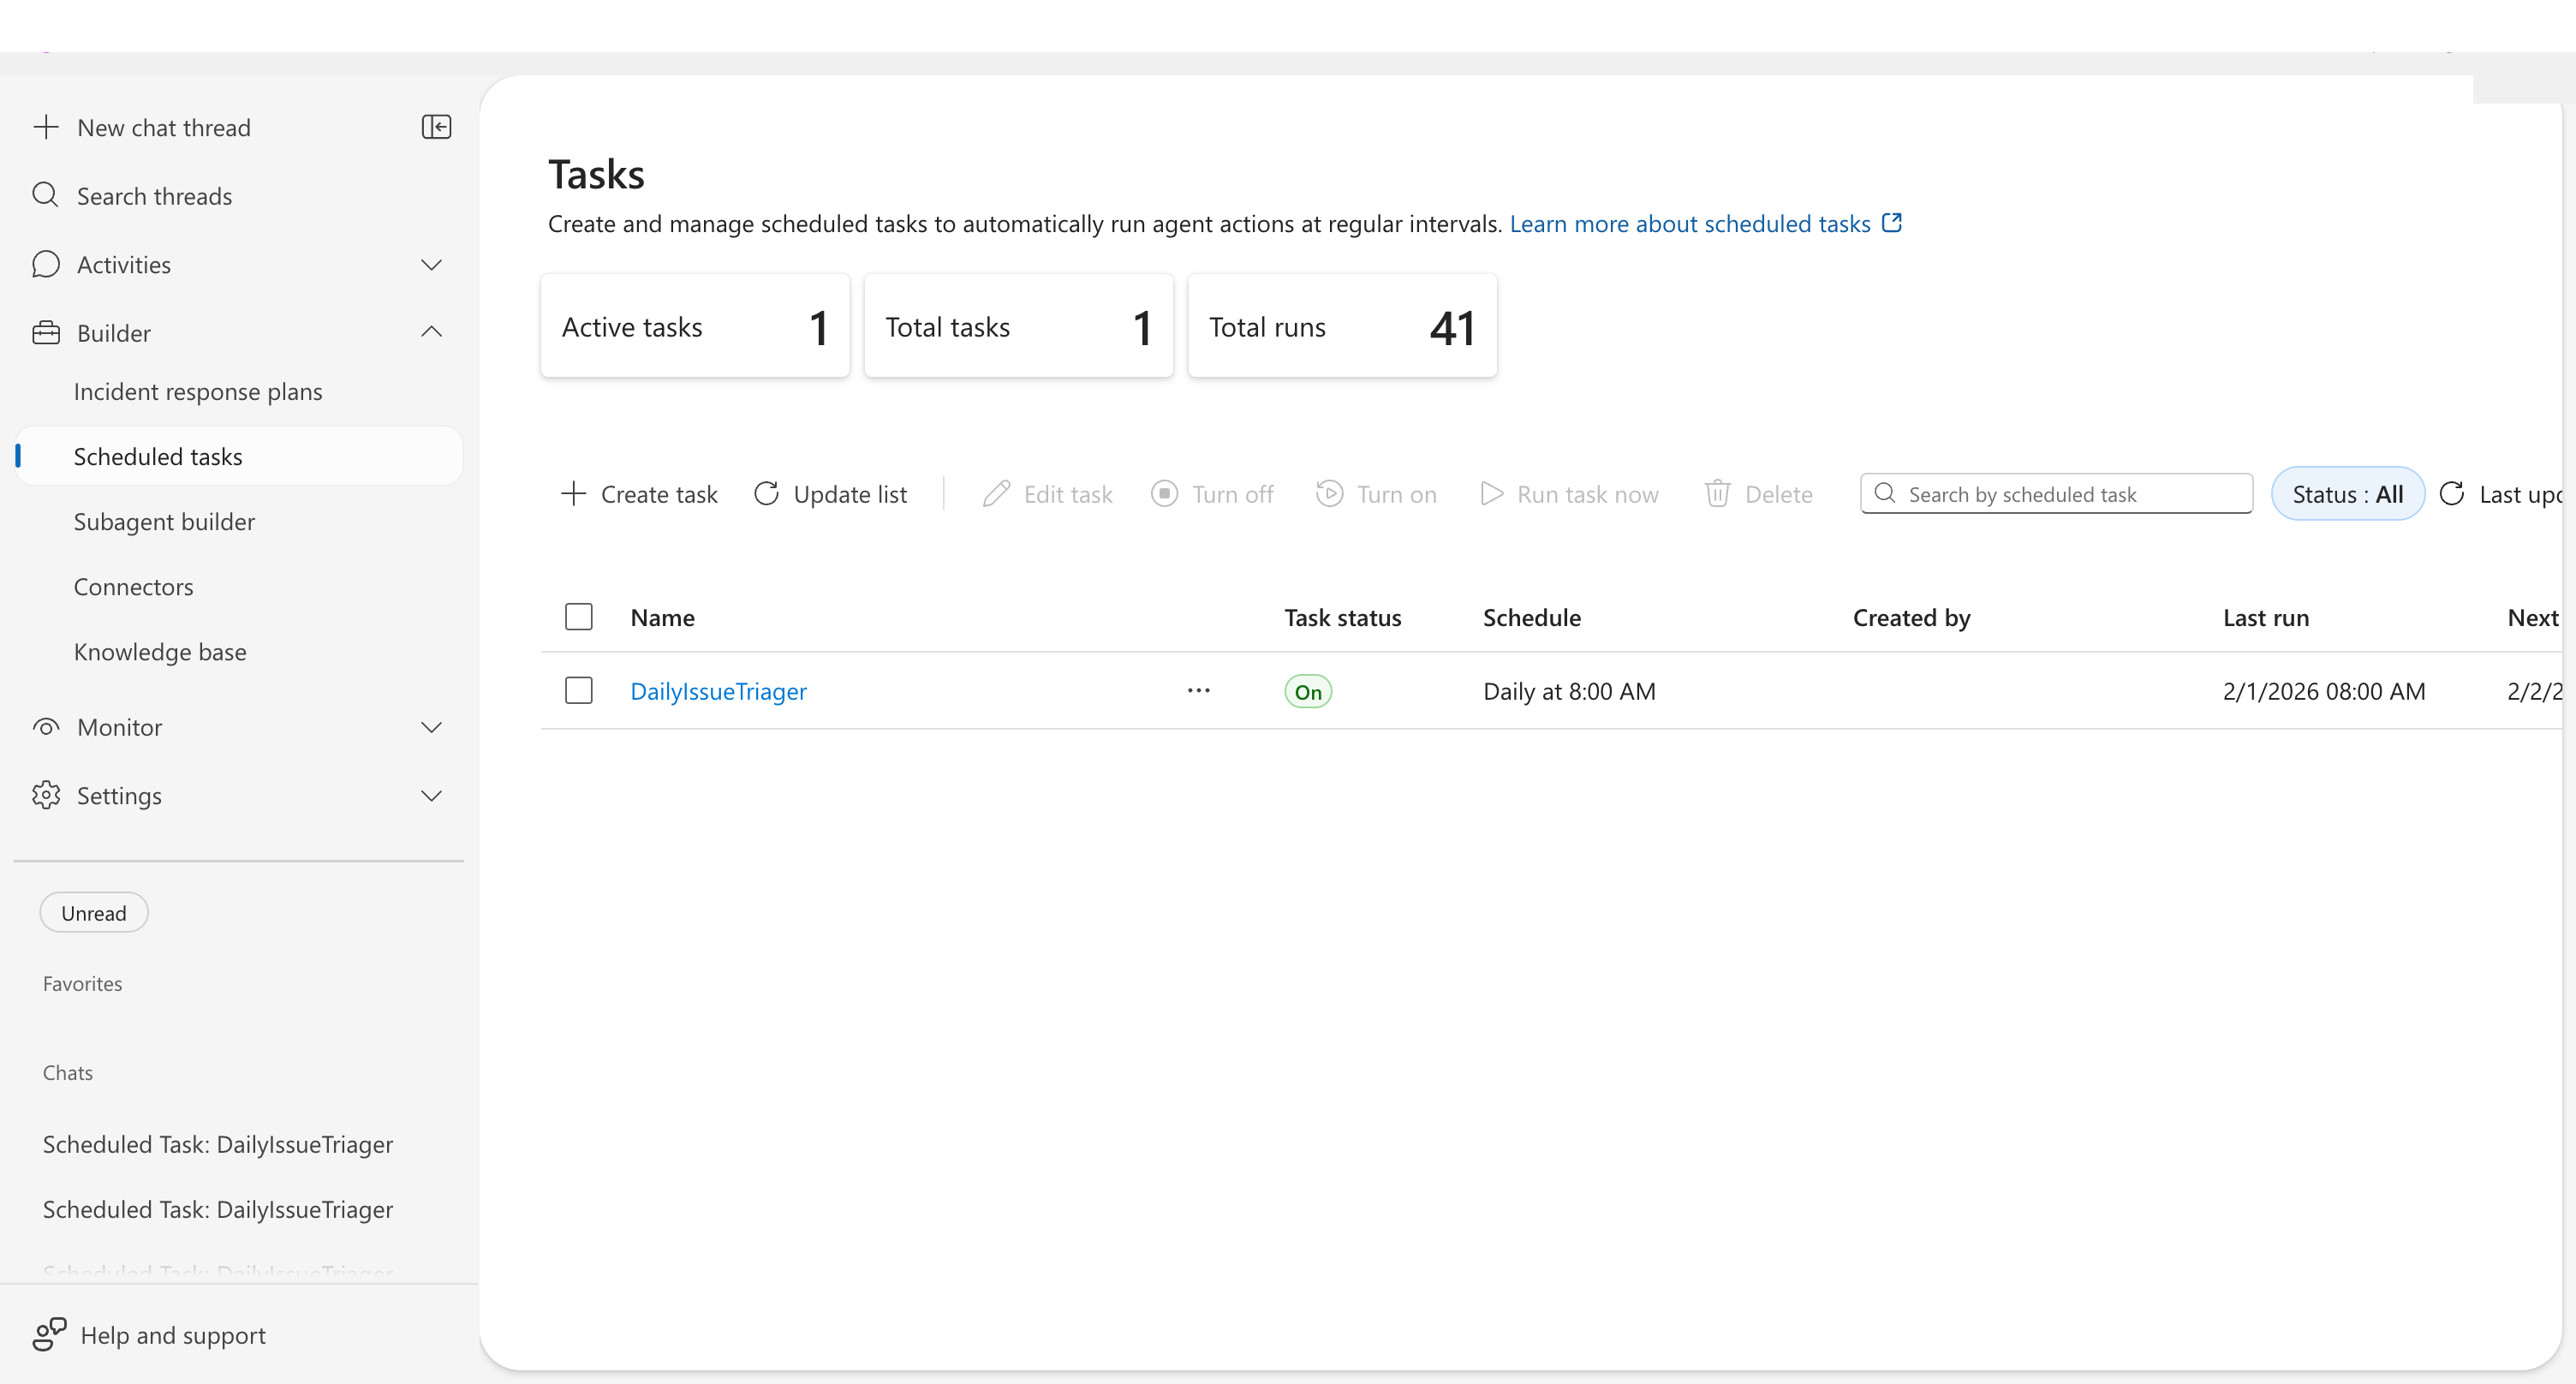
The dashboard displays three key metrics at the top:
| Metric | Description |
|---|---|
| Active tasks | Tasks currently enabled and running on schedule |
| Total tasks | All tasks including paused and completed |
| Total runs | Completed executions across all tasks |
The task list shows each task with sortable columns:
| Column | Description |
|---|---|
| Name | Task identifier — click to view execution history |
| Task status | On, Off, Ended, Failed, or Expired |
| Schedule | Human-readable format (e.g., "Daily at 8:00 AM") |
| Created by | Who created the task |
| Last run | Most recent execution time |
| Next run | Upcoming scheduled execution |
| Completed runs | Total successful executions |
Editing a task
Modify any scheduled task directly — change the schedule, update instructions, reassign the subagent, or adjust run parameters. Your task's execution history is preserved.
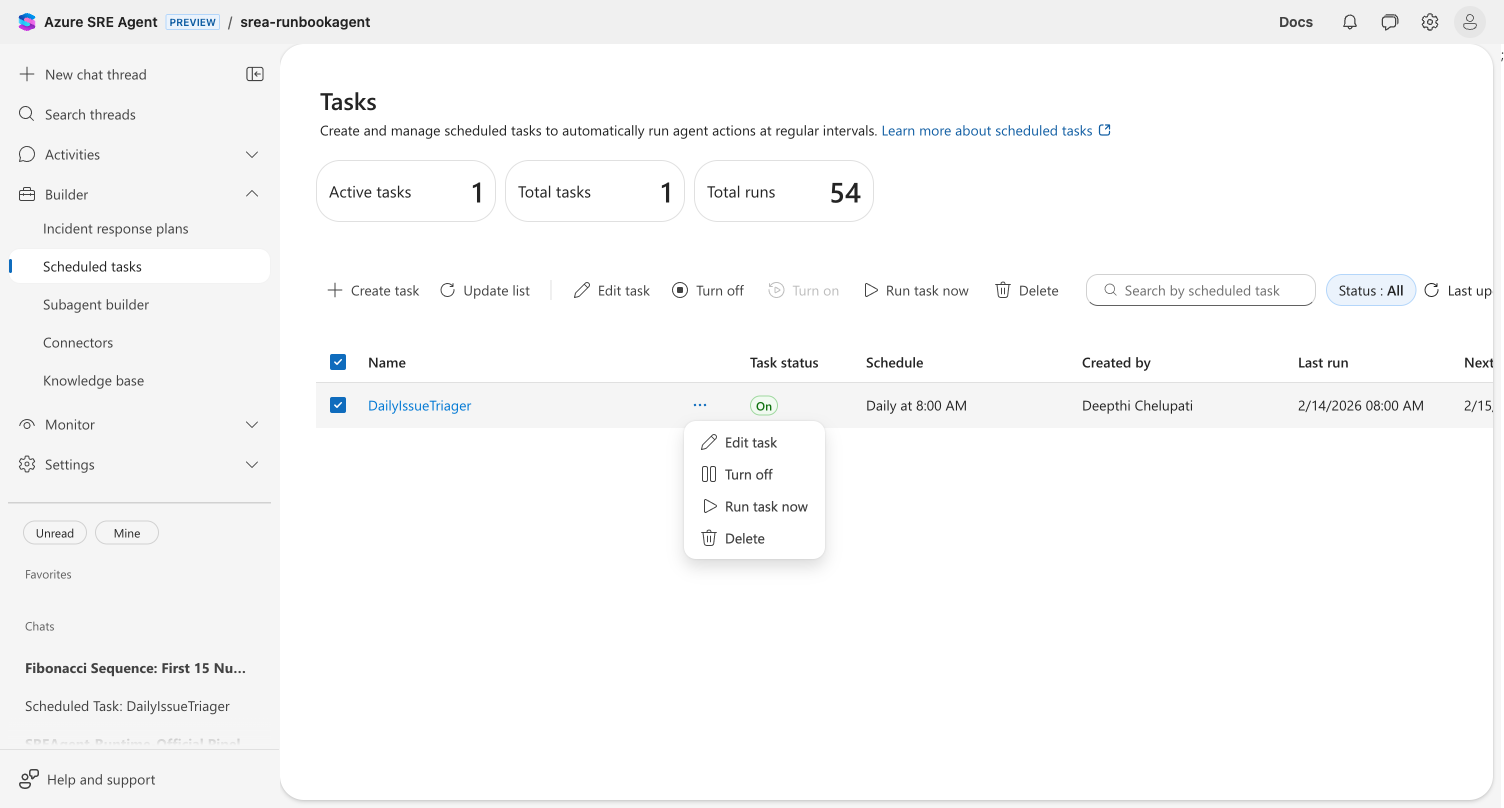
Three ways to edit
| Method | Steps |
|---|---|
| Toolbar | Select a task checkbox → click Edit task in the toolbar |
| Row menu | Click ⋯ on any task row → select Edit task |
| Execution view | Click a task name to open execution history → click Edit task |
The edit dialog opens with all current values pre-populated. Change any combination of fields:
- Task name and instructions — update what the agent does
- Schedule — change frequency, time, or switch to a custom cron expression
- Response subagent — reassign to a different subagent
- Date range — adjust start date or set a new end date
- Message grouping for updates — switch between same thread or new threads per run
- Model tier — change the AI model tier based on task complexity
- Set a run limit — add, change, or remove the maximum execution count
- Agent autonomy level — switch between Autonomous and Review mode. When you select Autonomous, an info icon (ℹ️) appears — click it to review the Autonomous mode acknowledgement, which explains agent boundaries, AI model limitations, your responsibilities, and liability terms.
Click Save to apply your changes.
Save is disabled until you modify at least one field, preventing accidental no-op updates.
Model tiers
Each task can use a different AI model tier, letting you balance quality and cost per task. Select a tier when creating or editing a task.
| Tier | Best for | Trade-off |
|---|---|---|
| Reasoning | Complex, multi-step analysis — deep investigations, root cause analysis | Highest quality, higher cost and latency |
| Fast Reasoning | Most tasks — health checks, reports, monitoring | Good reasoning with low latency |
| General Purpose (default) | Standard tasks — status checks, data retrieval | Balanced accuracy, cost, and speed |
| Fast | Simple polling, heartbeat checks, quick lookups | Lowest cost, fastest response, reduced accuracy |
Use Fast for simple recurring checks (resource health polling, metric queries) and reserve Reasoning for complex investigations. This can significantly reduce model costs for high-frequency tasks.
The model tier override applies only to the task — it does not change the agent's default model. Existing tasks without a tier set use the default (General Purpose).
High-frequency schedule warning
When you use a Custom cron expression that runs more often than every 30 minutes and your Repeat until date is more than one day out, a warning appears in the create or edit dialog:

The warning is advisory — it does not block task creation. Review your schedule and consider whether a lower frequency meets your needs. Each execution consumes model tokens and counts toward your agent's usage.
Execution artifacts
When a task execution produces file outputs — CSV exports, PDF reports, chart images — those files appear as downloadable chips directly on the automation card. No thread diving required.
Artifacts are extracted from two sources:
- Markdown file links in the agent's response (preferred)
- Python execution outputs as a fallback when no links are present
Each chip is color-coded by file type: documents (cranberry), data files (seafoam), images (marigold), code (blue), and archives (neutral). Click any chip to download the file with one click.
| Limit | Value |
|---|---|
| Artifacts per execution | 20 |
| Visible chips (collapsed card) | 3 (with "+N more") |
| Visible chips (expanded / run history) | 5 (with "+N more") |
Expand the card or view the run history for per-execution artifact lists.
If your tasks don't produce artifacts, update their instructions to include file generation — for example, add "export results as a CSV file" to the task description.
Example use cases
| Use case | What the agent does |
|---|---|
| Daily health check | Reviews resource health, checks for degraded services, reports findings |
| Cost anomaly detection | Compares spend to baselines, flags unexpected increases |
| Security posture review | Checks for misconfigurations, expired certificates, open ports |
| Deployment verification | Verifies recent deployments are healthy after rollout |
| SLA reporting | Generates weekly availability and performance summaries |
Example task prompts
Daily health check:
Review the health of all container apps in resource group prod-apps. Report any with restarts in the last 24 hours, memory usage above 80%, or error rates above 1%. Compare current error rates to last week's average.
Cost anomaly detection:
Analyze Azure cost data for my subscription. Compare today's spending rate to the 7-day average. Flag any resource group where spending increased more than 20%.
Get started
| Resource | What you'll learn |
|---|---|
| Create a Scheduled Task → | Step-by-step tutorial |
Related capabilities
| Capability | What it adds |
|---|---|
| Execute Mitigations → | Take action when monitoring detects issues |
| Workflow Automation → | Chain tasks with triggers, custom agents, and notifications |
| Send Notifications → | How the agent delivers findings to your team |
| Run Modes → | Control agent autonomy per task |
| Connectors → | Access third-party observability tools |