Azure Data Explorer Connector
- Connect to ADX clusters — give your agent access to logs and telemetry stored in Azure Data Explorer
- Multiple clusters in one connector — group cluster URIs by managed identity instead of creating separate connectors
- Per-cluster health checks — see which clusters are healthy and which need attention, individually
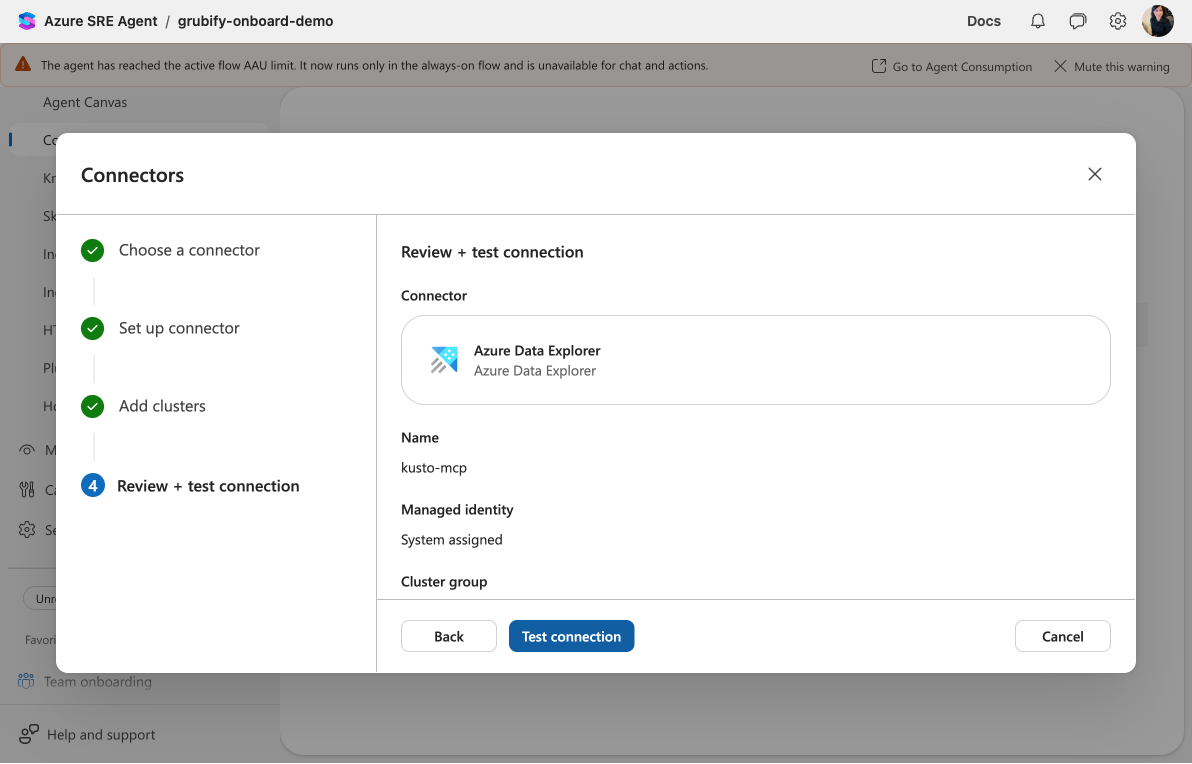
- Test before you save — the wizard tests connectivity to each cluster before creating the connector
Why connect to Azure Data Explorer?
Azure Data Explorer (Kusto) is where teams store operational telemetry — application logs, infrastructure metrics, deployment traces, and service health signals. Connecting your agent to ADX lets it query this data directly when diagnosing incidents, running health checks, or generating reports.
With the ADX connector, your agent can:
- Query logs across multiple clusters and databases
- Correlate telemetry from different regions or services during an incident
- Run scheduled health checks against your telemetry data
- Power Kusto tools with deterministic, parameterized queries
What the connector enables
Once you create an ADX connector, your agent automatically gains access to Kusto query tools — no additional setup required. These tools let the agent:
| Tool | What it does |
|---|---|
| Query | Run KQL queries against any connected cluster and database |
| List databases | Discover available databases on a cluster |
| List tables | Show tables within a database |
| Table schema | Inspect column names and types for a table |
| Sample data | Preview rows from a table |
This means the moment your connector tests successfully, you can ask your agent questions like:
Show me error rates from the servicetelemetry database in the last 24 hours
The agent writes and executes KQL on your behalf, using the connector's managed identity for authentication.
Two ways to query
| Approach | How it works | Best for |
|---|---|---|
| Ad-hoc queries | Agent generates KQL during chat based on your question | Investigations, exploration, one-off analysis |
| Kusto tools | Pre-built, parameterized KQL templates you define once | Repeatable health checks, standardized reports |
Ad-hoc queries work immediately with the connector. For Kusto tools, see Kusto Tools to create reusable query templates.
How the ADX connector works
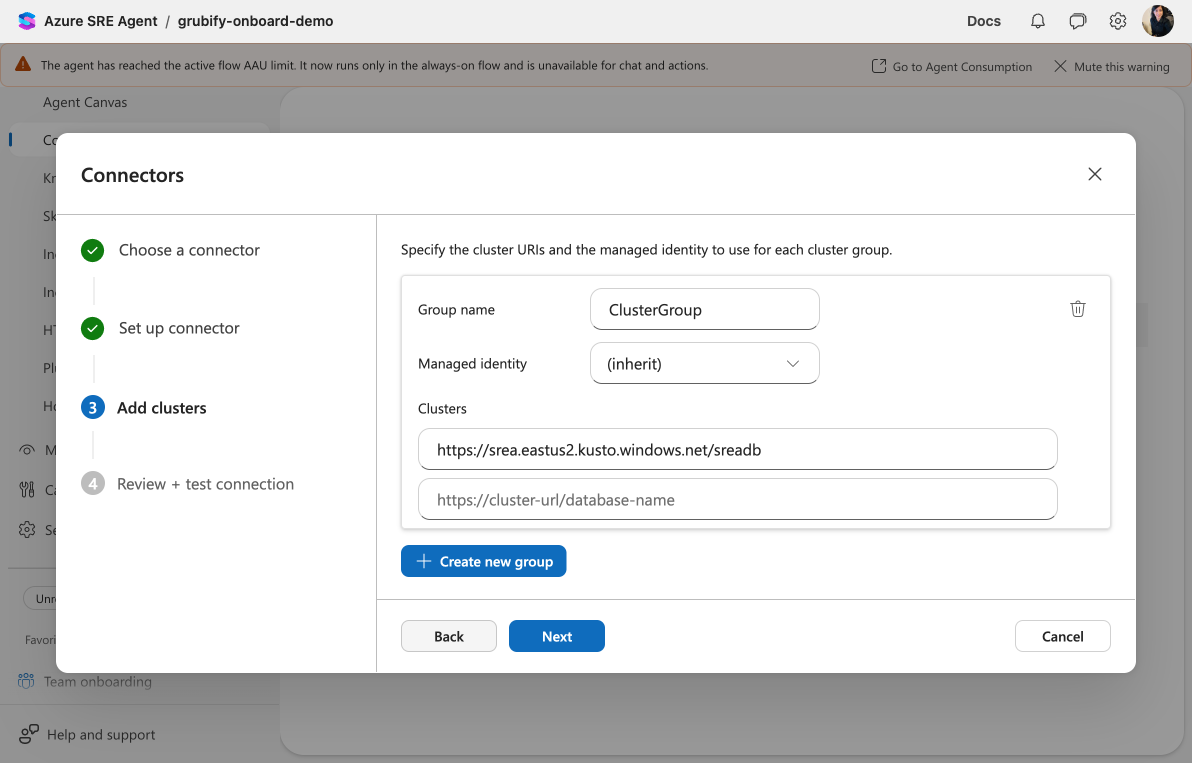
The ADX connector supports multiple clusters in a single connector through cluster groups. Each group shares a managed identity, so you don't need to create separate connectors for every cluster.
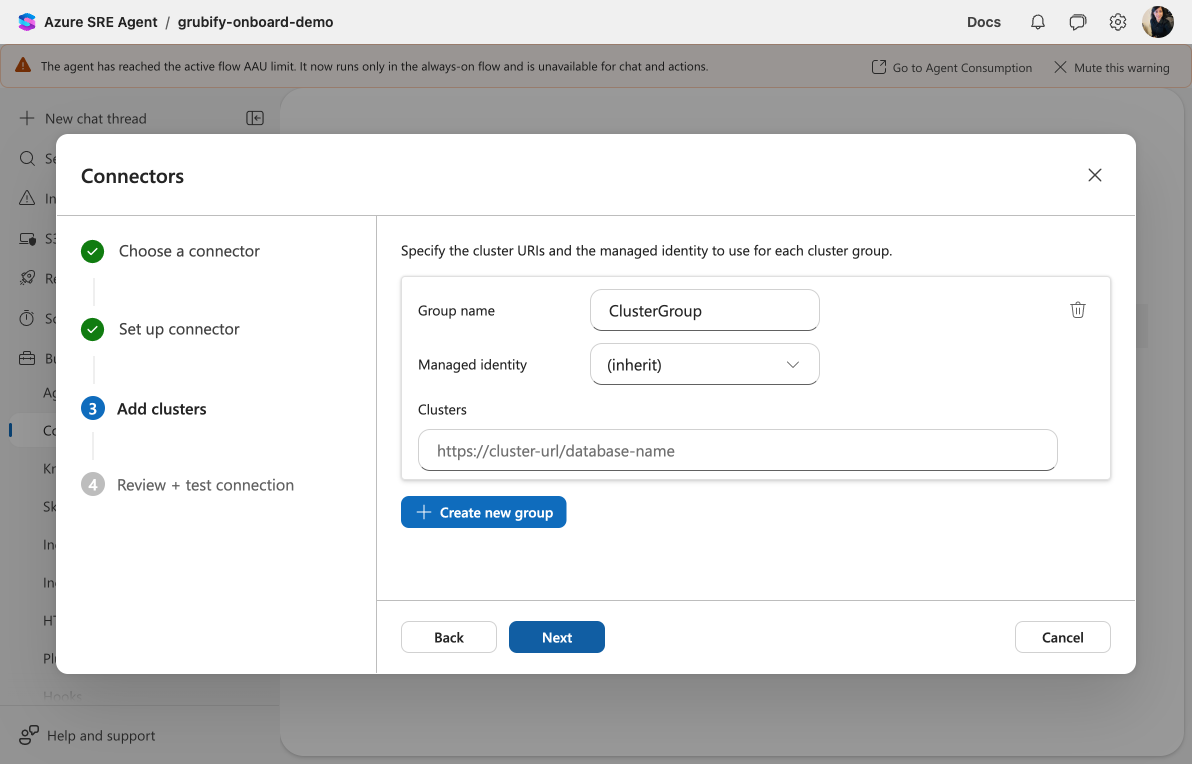
Cluster groups
A cluster group is a collection of ADX cluster URIs that share the same managed identity. You can have multiple groups within one connector — each with its own identity — to handle clusters across different tenants or permission boundaries.
For example, if your production clusters use one managed identity and your staging clusters use another, you create two groups within the same connector. The "(inherit)" option on each group uses the connector-level identity by default; override it per group when needed.
Per-cluster health checks
The connector tests each cluster individually — both during setup and on an ongoing basis. If some clusters become unreachable after saving, the connector status calls out the failing clusters by name (e.g., "2 cluster(s) failed: cluster1, cluster2") so you know exactly which cluster needs attention.
Editing connectors
You can add or remove cluster URIs from an existing connector without recreating it. The edit dialog opens directly to the cluster configuration — update URIs, adjust group identities, and re-test.
How authentication works
When your agent queries a Kusto cluster, the platform handles token acquisition automatically. You don't need to manage bearer tokens or configure auth headers.
All you need to do is:
- Grant the managed identity database access (viewer role or higher)
- Create the connector with the correct cluster URIs
The platform handles token acquisition, credential injection, and token refresh.
Example: connecting regional telemetry clusters
Your team runs services across three Azure regions, each with its own ADX cluster:
| Cluster | Database | Region |
|---|---|---|
https://prod-westus.westus.kusto.windows.net/servicetelemetry | servicetelemetry | West US |
https://prod-eastus.eastus.kusto.windows.net/servicetelemetry | servicetelemetry | East US |
https://prod-westeu.westeurope.kusto.windows.net/servicetelemetry | servicetelemetry | West Europe |
With cluster grouping, you create one connector named prod-telemetry, select your managed identity, and add all three cluster URIs in a single group. After testing confirms all three clusters connect, your agent can query telemetry from any region through one connector.
Related capabilities
| Capability | What it adds |
|---|---|
| Kusto Tools → | Create deterministic, parameterized queries using this connector |
| Diagnose with Observability Data → | Use ADX telemetry for incident diagnosis |
| Connectors → | How connectors give your agent access to external data sources |
Get started
Set up your ADX connector: Connect to Azure Data Explorer →.