Test Tool in Playground
Test and debug your Kusto tools and system tools in the playground before deploying to production. Learn more → Agent Playground. Time: ~5 minutes.
Prerequisites
- At least one tool created (Kusto tool or system tool available)
Step 1: Open the playground
- Go to Builder > Agent Canvas
- Click Test playground in the view toggle (next to Canvas view and Table view)
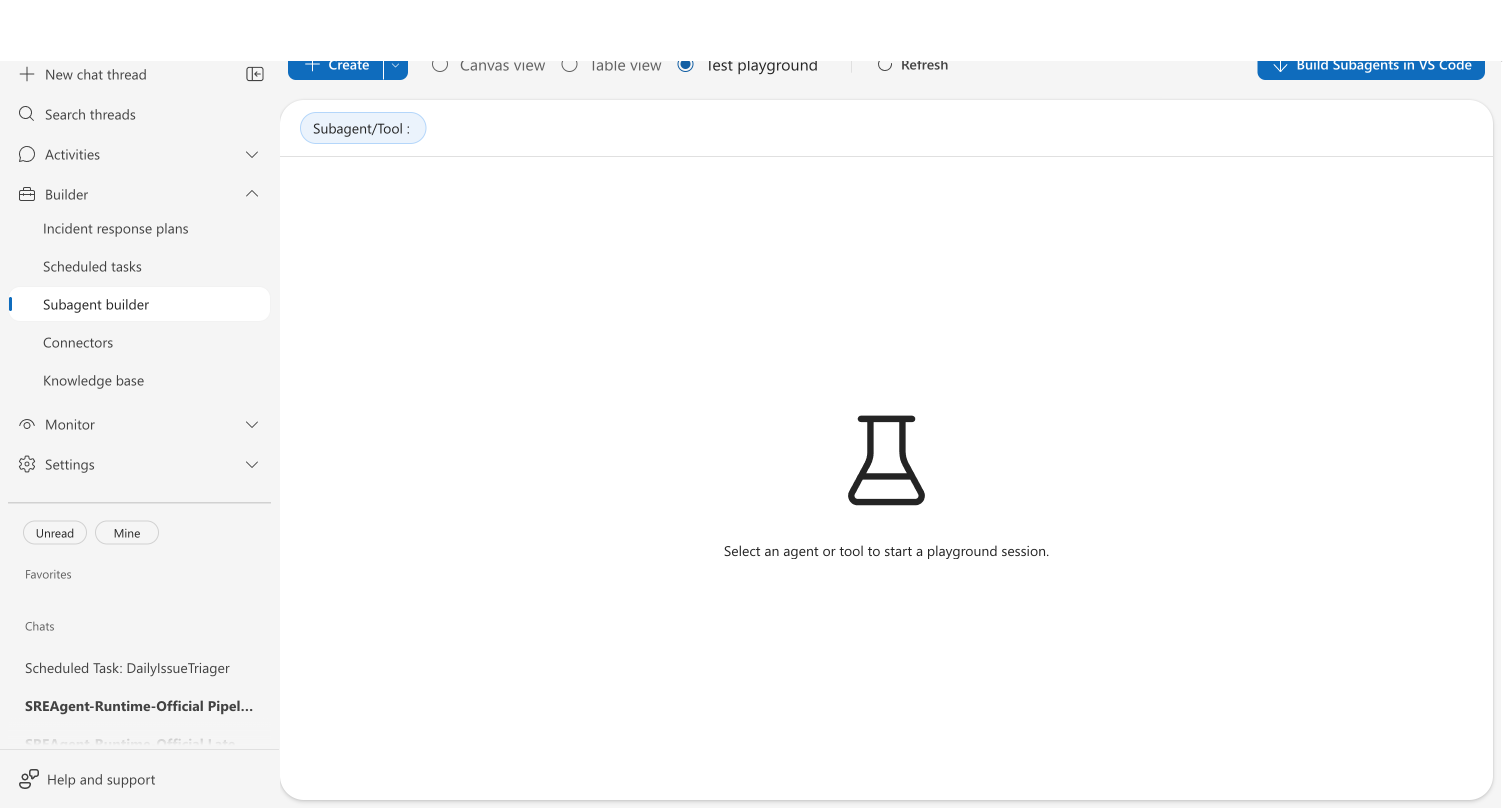
You see an empty state with a Custom agent/Tool selector at the top and the message "Select an agent or tool to start a playground session."
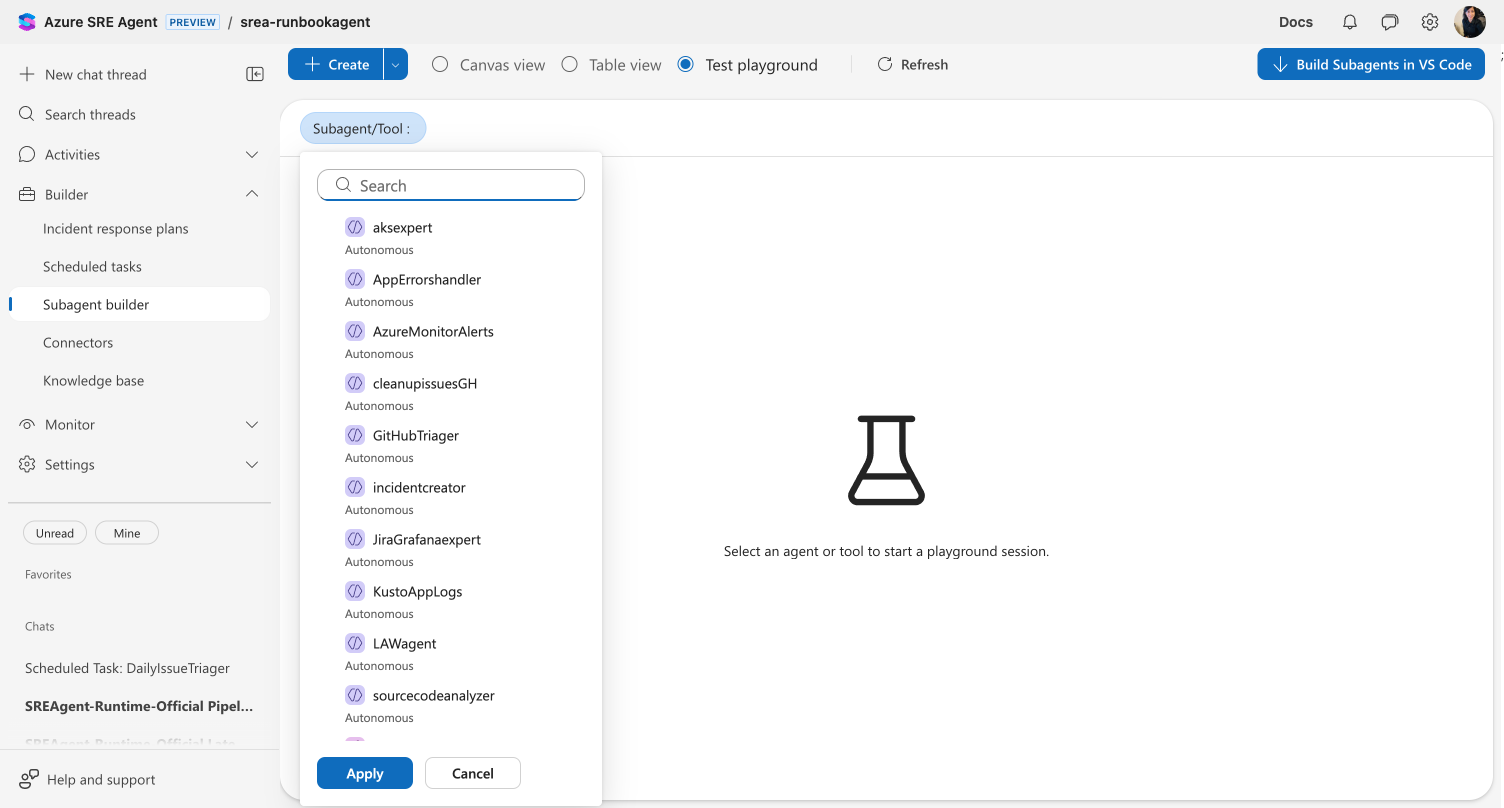
Step 2: Select your tool
- Click the Custom agent/Tool dropdown at the top
- Browse or search the list — each entry shows a sublabel indicating its type (such as Autonomous for custom agents, Built-in Tool for system tools, or Kusto tool for Kusto tools)
- Select the tool you want to test
- Click Apply
Checkpoint: The playground loads the selected tool's configuration and test interface.
Step 3: Test a Kusto tool
If you selected a Kusto tool:
- The left panel shows your query configuration — cluster, database, query text, and parameter definitions
- The right panel shows the test area with parameter input fields
- Fill in any parameter values required by your query
- Click Run test
Expected result: The test panel shows:
- Success or failure status
- Row count and columns returned
- Query results displayed in a table
- Execution time in milliseconds
Checkpoint: A green success indicator confirms your query runs correctly against the connected cluster.
The Save button is disabled until you run a successful test. This ensures you only save queries that actually work against your cluster.
If the query returns unexpected results, adjust your KQL on the left and click Run test again. You can iterate without leaving the playground.
Step 4: Test a system tool
If you selected a system tool:
- The left panel shows tool information — name, description, plugin, and category
- The right panel shows parameter input fields
- Fill in the required parameter values
- Click Execute Tool
Expected result: The tool executes and displays JSON output in an embedded editor.
Checkpoint: The result JSON appears with syntax highlighting. Verify the output matches the expected behavior for your inputs.
Step 5: Verify and iterate
After testing:
- Kusto tool — If results are wrong, adjust your KQL and re-run. Click Save when the query is correct (Save is only enabled after a successful test run).
- System tool — If output is unexpected, check your parameter values and re-execute.
Changes to Kusto tools are saved when you click Save. System tools don't require saving — they execute with the parameters you provide.
What you learned
- How to access the Test playground in the Agent Canvas
- How to use the Custom agent/Tool selector to pick a tool
- How to test tools in isolation, independent of any agent
- How to verify behavior matches expectations before saving
Troubleshooting
| Issue | Solution |
|---|---|
| No tools appear in the selector | Create at least one tool first — click Create > Tool > Kusto tool in the Agent Canvas |
| Kusto tool shows "No connectors configured" | Add an Azure Data Explorer connector in Builder > Connectors with cluster URL and database |
| Kusto test shows authorization error | Verify a data connector is configured and has query permissions on the target database |
| System tool returns an error | Check that all required parameters are filled in and values match expected format |
| Python tools are not listed | Python tools have their own test interface inside the Python tool editor — open from Agent Canvas canvas |
Related
| Resource | What you'll learn |
|---|---|
| Create Kusto Tool | Build a reusable KQL query |
| Create Python Tool | Build custom Python functions |
| Agent Playground | Test full agent behavior with evaluation |