Step 4: Automate Incident Response
Connect your incident platform and let the agent handle alerts automatically — from detection to diagnosis to fix, without you typing a single message.
What you'll accomplish
- Connect Azure Monitor as your incident platform
- Create a response plan with severity filters and autonomy settings
- See the agent handle a real alert end-to-end — from acknowledgment to code fix and PR
Prerequisites
| Requirement | Details |
|---|---|
| Completed Steps 1–3 | Create agent, Team onboarding, First investigation |
| Azure resources connected | At least one Azure subscription with resources the agent can monitor |
Connect Azure Monitor
- In the left sidebar, go to Builder → Incident platform.
- Click the Incident platform dropdown and select Azure Monitor.
- The Quickstart response plan toggle is on by default. Turn it off — you will create your own response plan next.
- Click Save.
Wait for the connection to complete. The status changes to "Azure Monitor connected. Your next step is to set up incident response plans."
Checkpoint: The incident platform page shows a green checkmark with "Azure Monitor connected."
You can also connect PagerDuty or ServiceNow from the same dropdown.
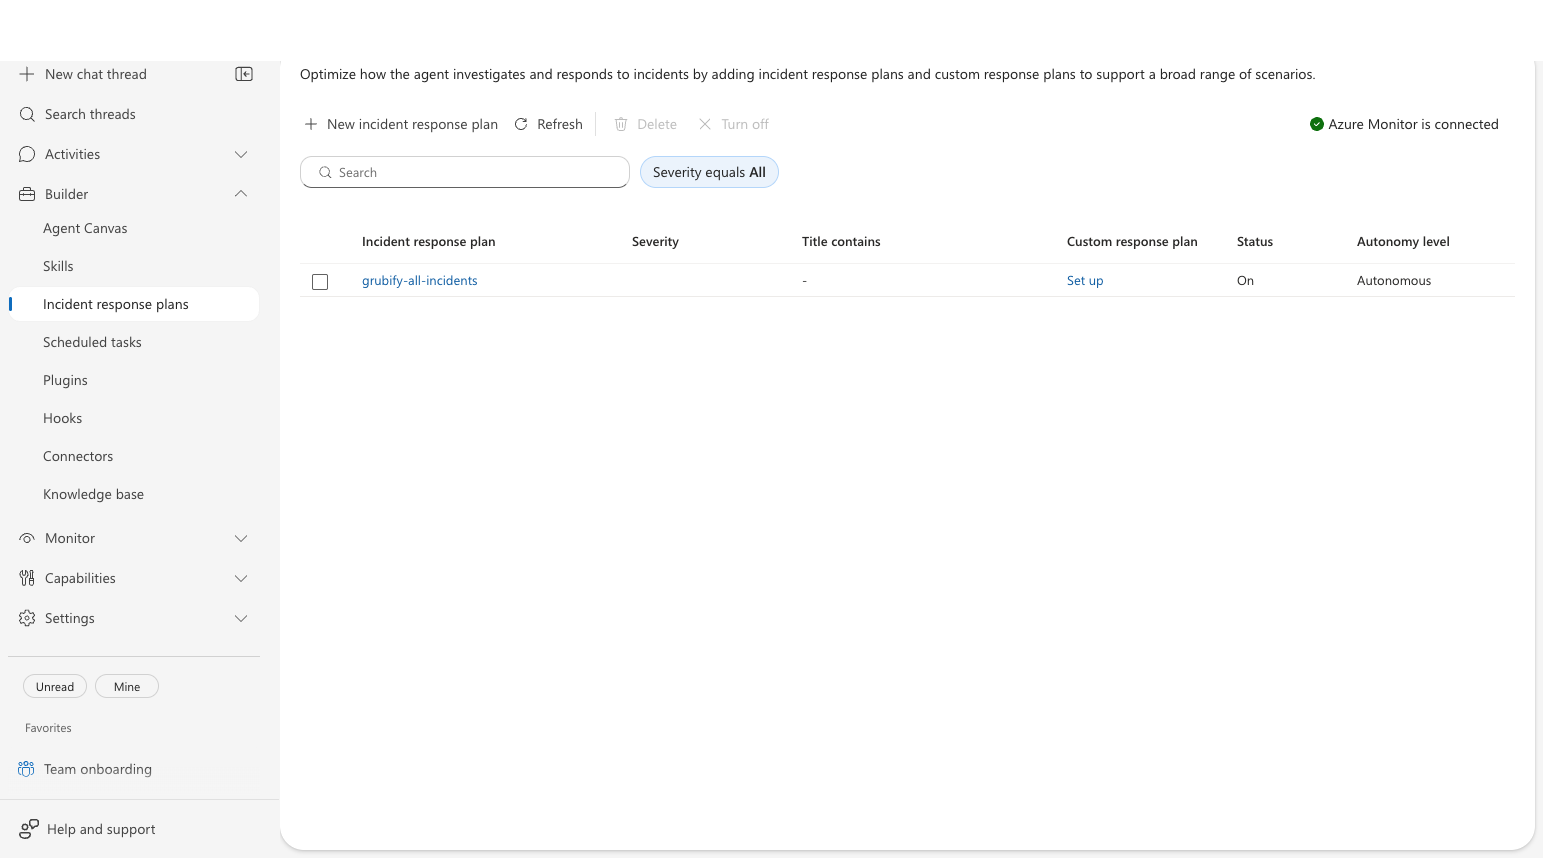
Create an incident response plan
An incident response plan tells the agent which incidents to pick up and how much autonomy it has. The steps below are for Azure Monitor — PagerDuty and ServiceNow response plans use different filter fields based on their own incident metadata (priority, category, assignment group, etc.).
- Go to Builder → Incident response plans in the left sidebar.
- Click New incident response plan.
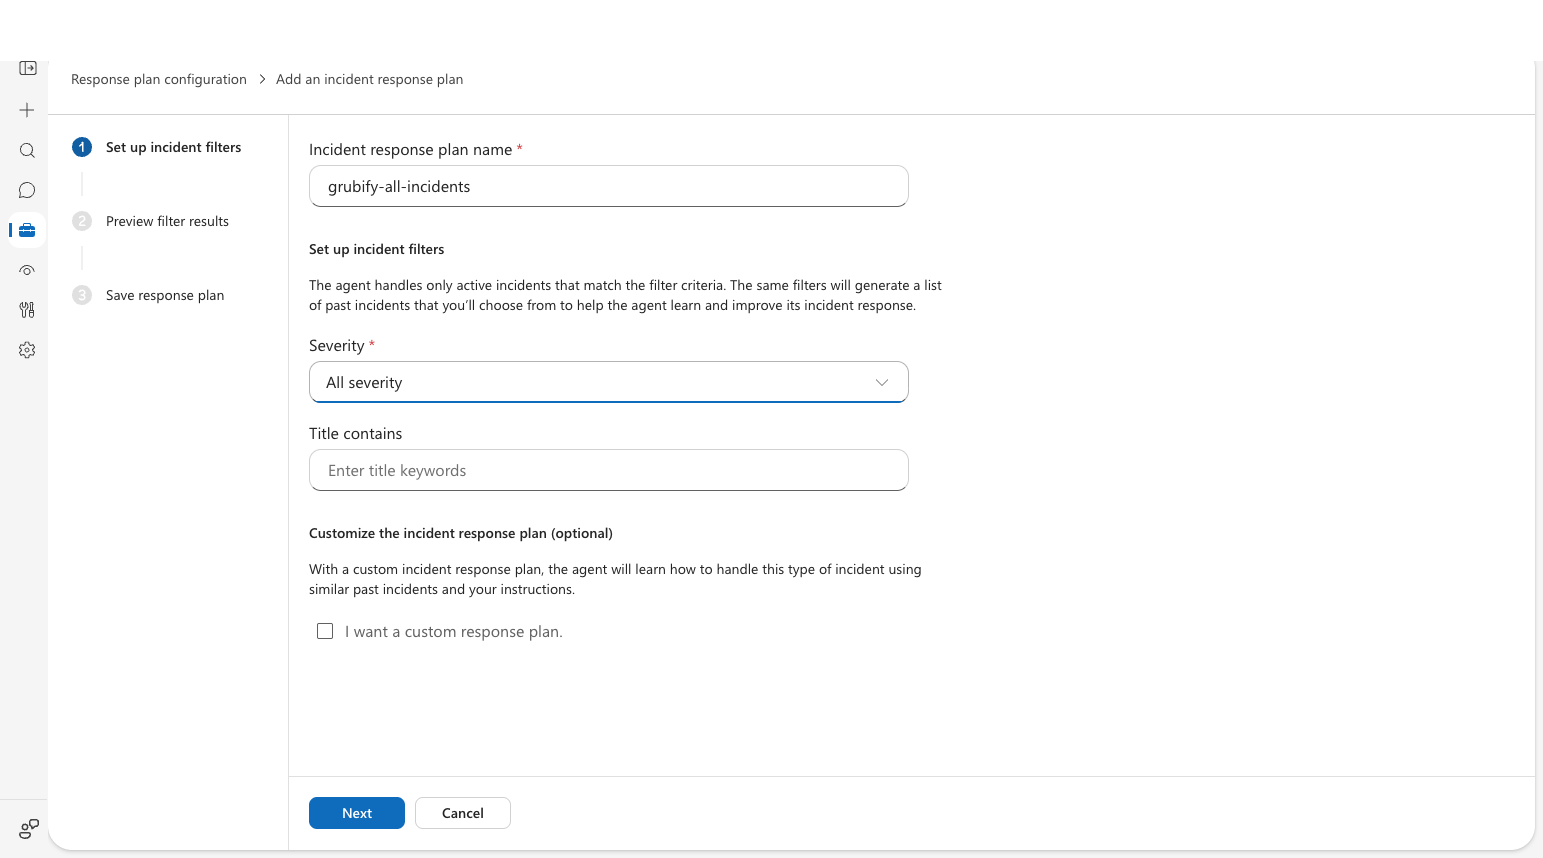
- Step 1 — Set up incident filters:
- Enter a name (e.g.,
all-incidents). - Select severity levels — choose All severity to catch everything during setup.
- Optionally add a title filter to narrow scope.
- Enter a name (e.g.,
- Click Next.
- Step 2 — Preview filter results: Review matching past incidents from your incident platform (empty if no incidents exist yet). Click Next.
- Step 3 — Save response plan:
- Choose how much control the agent has:
- Autonomous (Default) — the agent investigates and acts independently, including code fixes and container restarts.
- Review — the agent diagnoses but waits for your approval before acting.
- Click Save.
- Choose how much control the agent has:
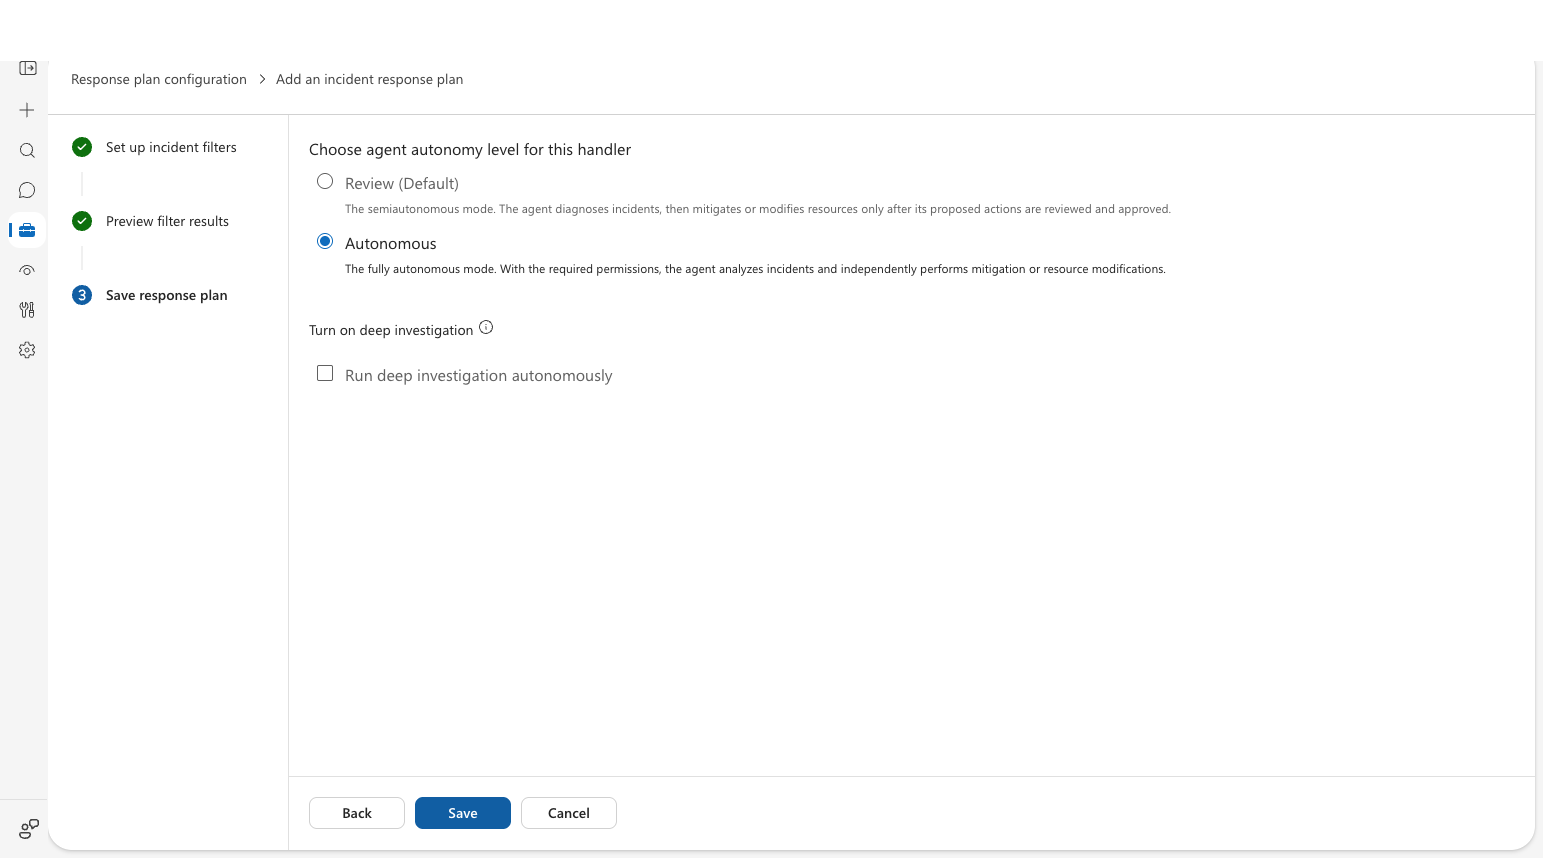
Checkpoint: Your response plan appears in the list with status On and the autonomy level you selected.
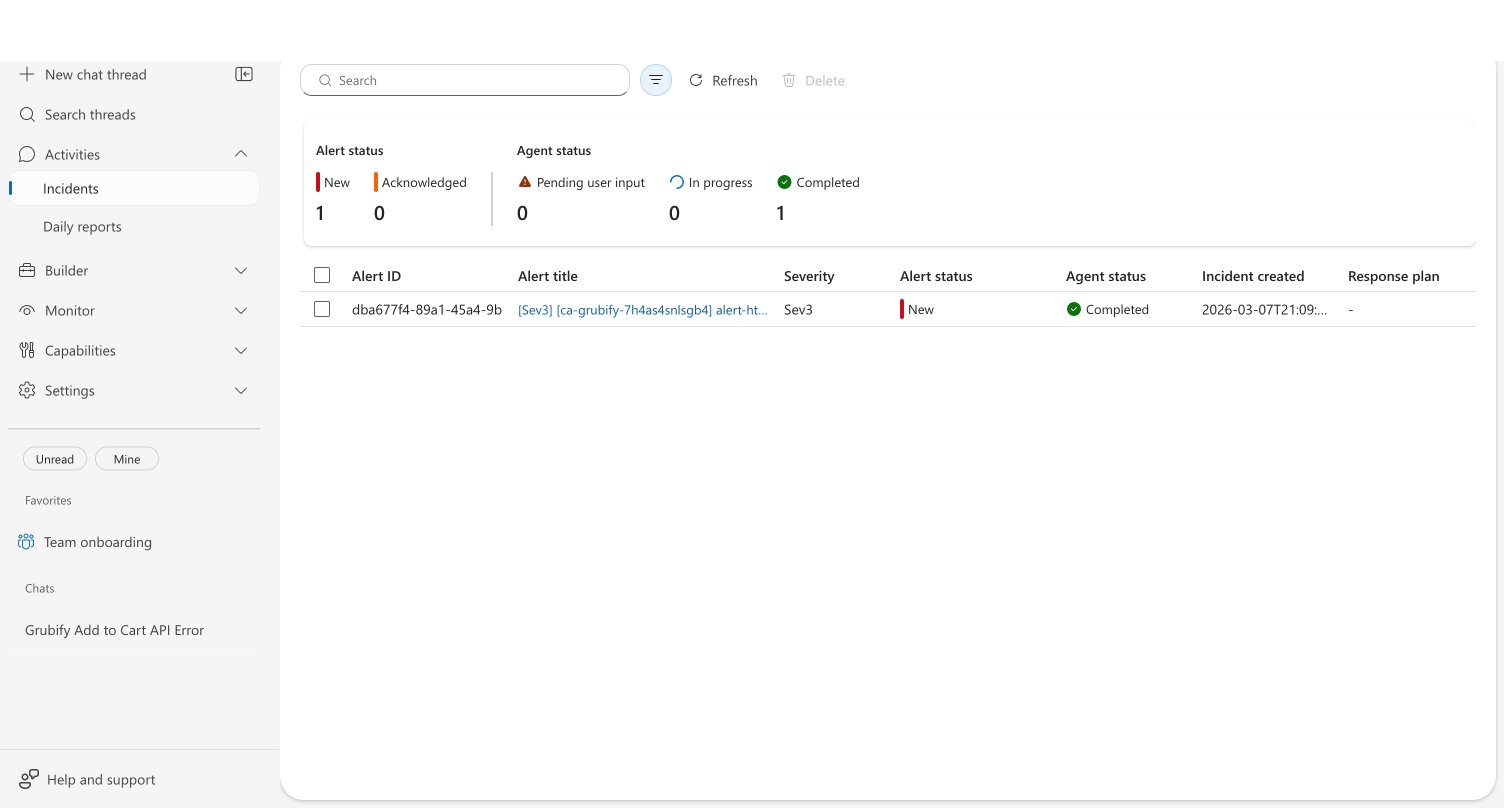
What happens when an alert fires
When Azure Monitor fires an alert that matches your response plan, the agent investigates automatically. What the agent does depends on the context you've given it — runbooks, code repositories, Azure resources, and prior investigations all shape the depth and actions of the investigation.
Example: HTTP 500 errors on a container app
In this example, the agent has a runbook for handling HTTP 500 errors, a connected code repository, and Azure resource access.
The agent builds a plan from your runbook. Rather than following a generic troubleshooting sequence, the agent reads the HTTP 500 runbook uploaded during onboarding and follows your team's procedures — checking upstream dependencies first, then connection pool, then recent deployments.

It recalls prior knowledge. If the agent investigated a similar issue before, it recognizes the pattern and skips discovery — combining your runbook procedures with what it learned from previous investigations.
It takes action. In Review mode, the agent asks for your approval before each action. In Autonomous mode, it acts independently. In this example, the agent:
- Read the source code and identified the root cause
- Edited the code to fix the bug
- Restarted the container to mitigate the alert
- Committed the fix and pushed it to a new branch
- Created a GitHub Issue for tracking
- Verified the service was healthy after the fix
It delivers a remediation summary. The agent produces a structured report with everything the team needs to follow up:
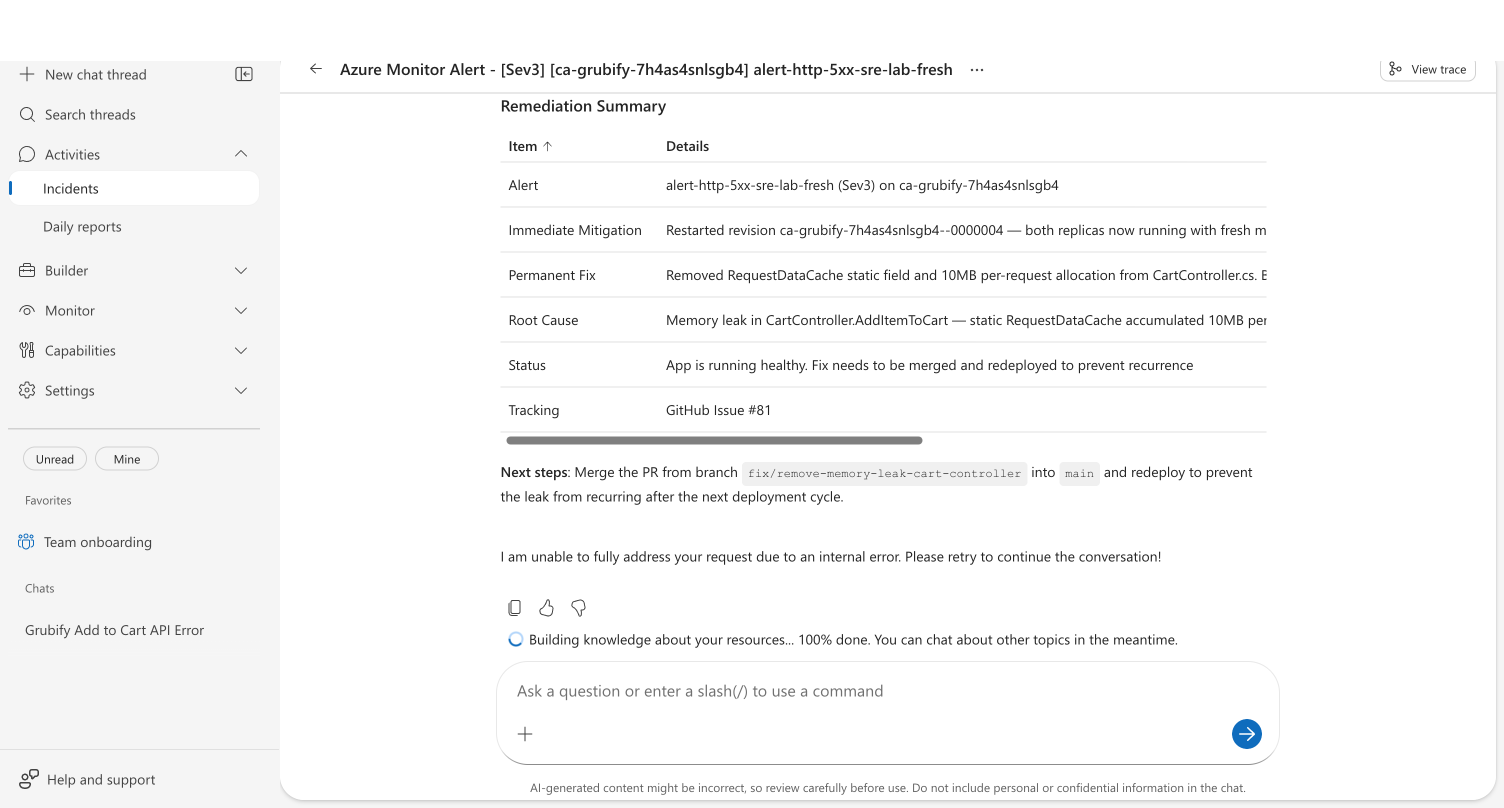
| Item | What the agent reports |
|---|---|
| Alert | Which alert fired, severity, affected resource |
| Immediate mitigation | What was done to restore service right now |
| Permanent fix | Code changes made and branch pushed |
| Root cause | Specific code bug or configuration issue with file references |
| Status | Current health of the affected resource |
| Tracking | GitHub Issue number |
| Next steps | Merge PR and redeploy |
Your results will vary based on the context your agent has. An agent with more runbooks, connected repositories, and prior investigations will produce deeper, more targeted responses.
Related capabilities
| Capability | What it adds |
|---|---|
| Incident Response Plans | Configure severity filters and custom response instructions |
| PagerDuty Incidents | Ingest and investigate PagerDuty incidents |
| Memory | How prior investigations improve future ones |
| Monitor Agent Usage | Track ongoing incidents and agent activity |