Step 3: Your First Investigation
Ask the agent to investigate an issue and watch it diagnose the root cause — using your code, Azure resources, and the knowledge files it built during onboarding.
What you'll accomplish
- Ask the agent to investigate a live issue in chat
- Watch it read source code, query Azure resources, and check logs in real time
- Receive a root cause diagnosis with code references and a recommended fix
Prerequisites
| Requirement | Details |
|---|---|
| Completed Steps 1–2 | Create and set up and Team onboarding |
| Code repository connected | The agent needs access to your source code to trace errors to specific files |
You can still run an investigation without all data sources connected, but the results are richer with code and Azure resources. See Complete Your Setup if you skipped anything.
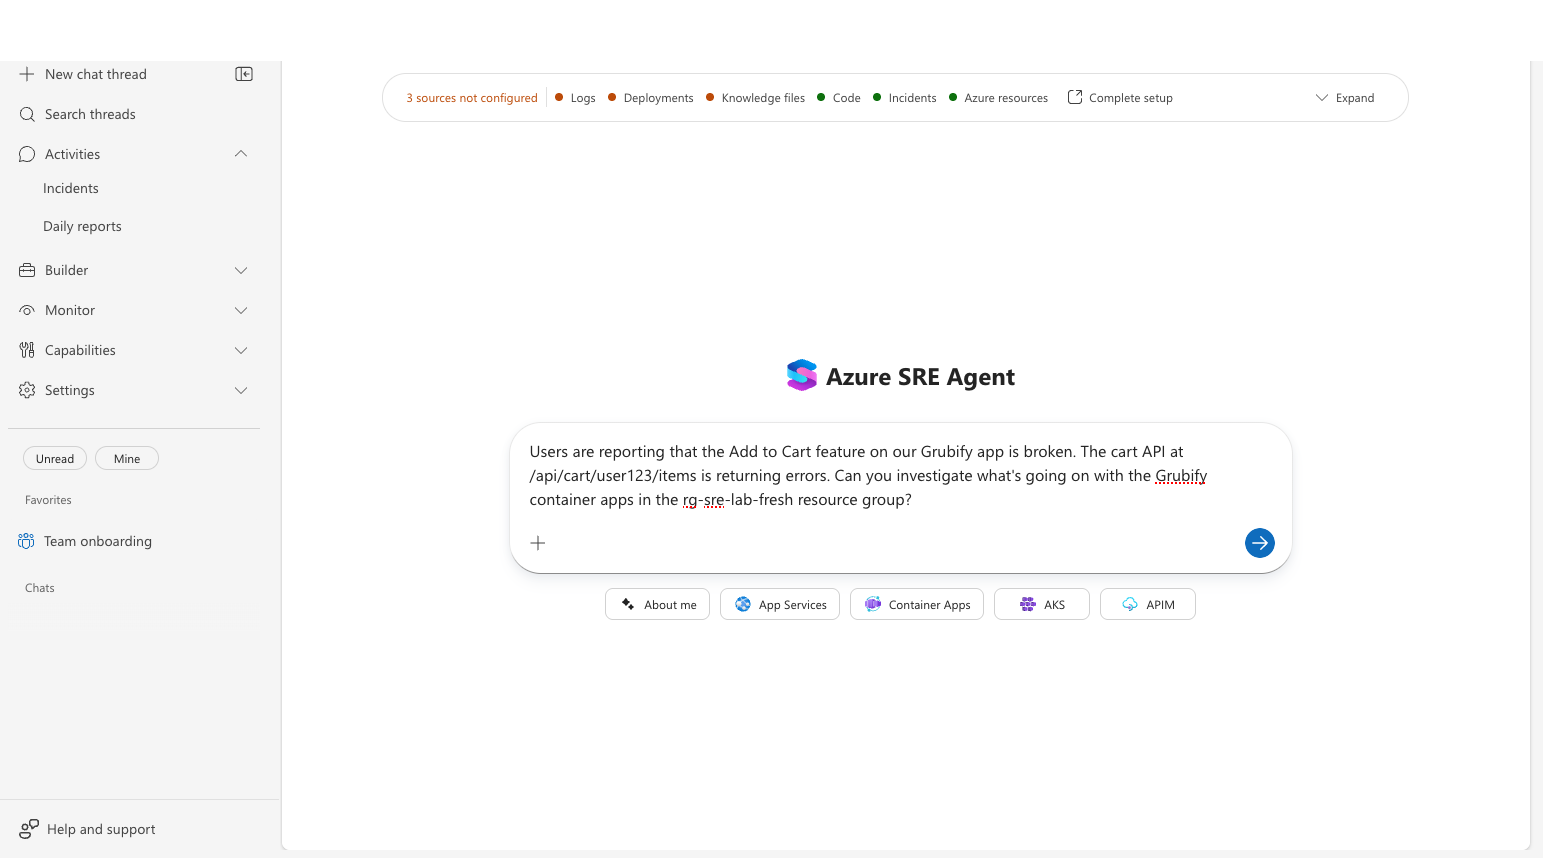
Start the investigation
-
Click New chat thread in the left sidebar.
-
Describe the issue you want investigated. Be specific about which service or resource group is affected. For example:
"Users are reporting that the Add to Cart feature on our app is broken. The cart API is returning errors. Can you investigate the container apps in the resource group?"
-
Click Send.
Watch the agent work
The agent builds an investigation plan and executes it step by step. You can watch each phase in real time.
Phase 1 — Read context: The agent reads the knowledge files it built during team onboarding — architecture docs, team context, and runbooks — to orient itself.
Phase 2 — Explore code: Using Deep Context, the agent reads source files from your connected repository. It searches for code paths related to the issue, identifies error handlers, and traces the call chain.
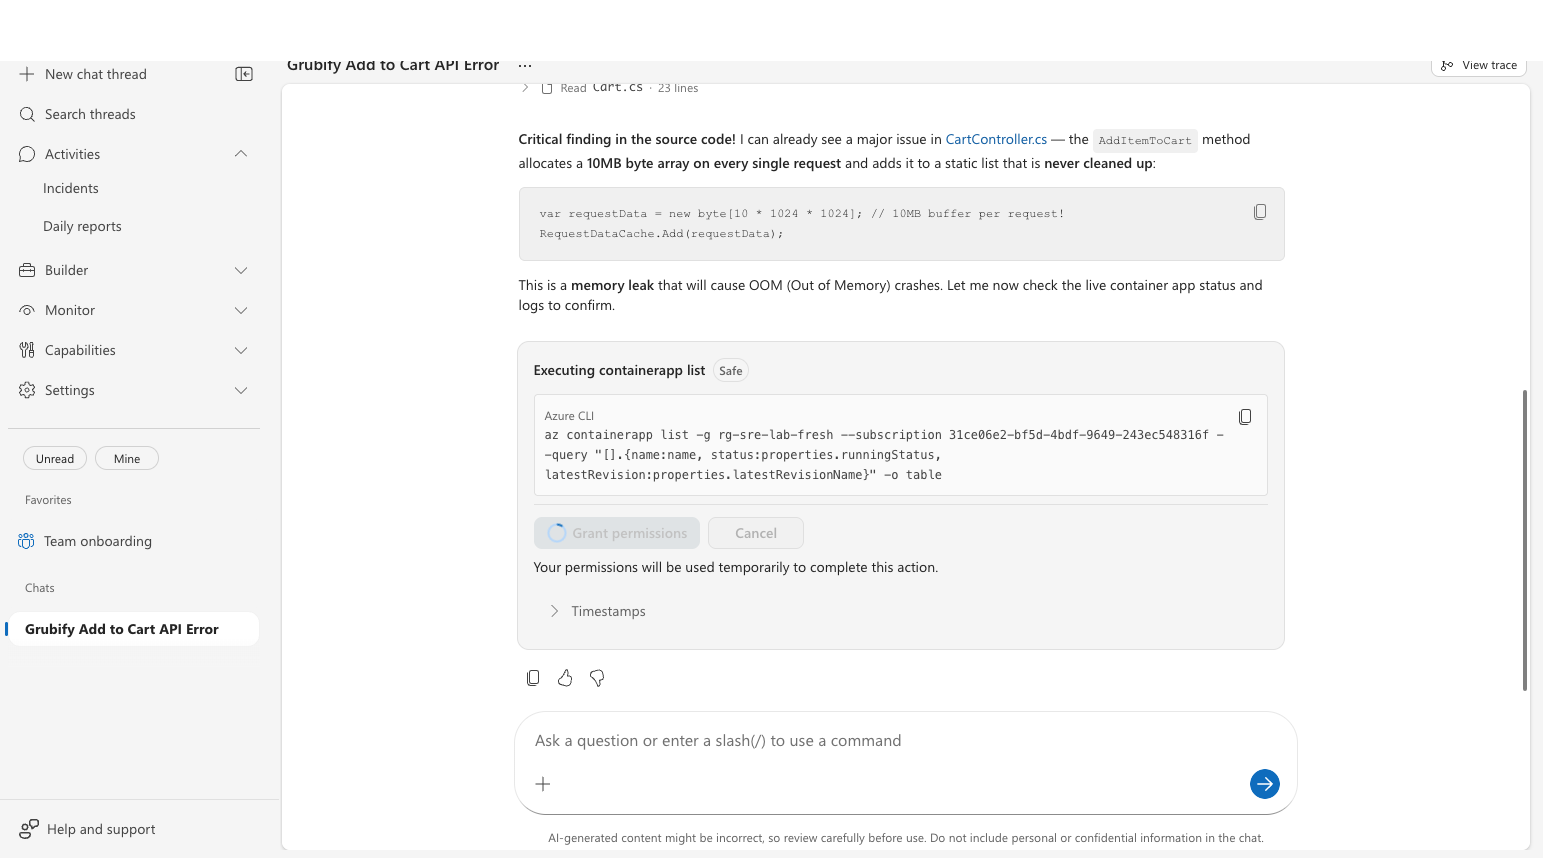
Phase 3 — Query Azure resources: The agent runs Azure CLI commands to check live resource state — container app status, memory and CPU limits, system logs, and console logs.
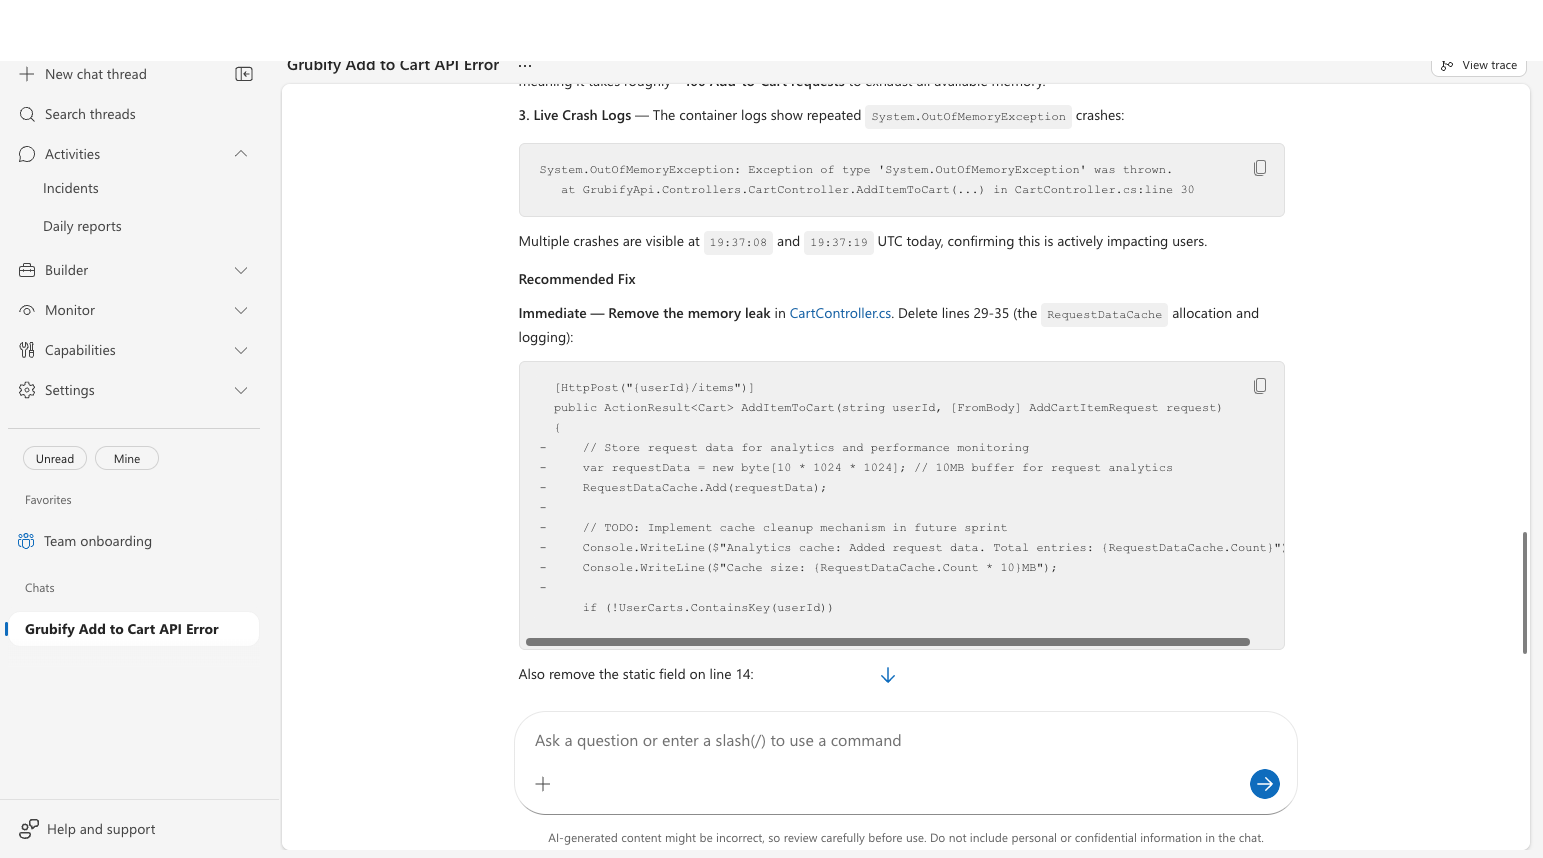
Phase 4 — Deliver the diagnosis: The agent presents a structured diagnosis with:
- Root cause — the specific code bug or configuration issue, with file and line number references.
- Evidence — code snippets, crash logs, and resource constraints that confirm the finding.
- Recommended fix — exactly what to change, with a code diff showing lines to remove or modify.
Checkpoint: The agent delivers a complete investigation — root cause, evidence from live logs, and a recommended code fix — all traced back to your actual source code and Azure resources.
Try asking about something real in your environment:
- "Check the health of the container apps in resource group X"
- "We're seeing 5xx errors on our API — can you investigate?"
- "What recent changes were deployed to our backend service?"
Related capabilities
| Capability | What it adds |
|---|---|
| Workspace Tools | How the agent reads, searches, and edits code |
| Root Cause Analysis | How the agent identifies root causes |