Debug Trace
- See your agent's complete reasoning trail for any conversation — every tool call, model decision, and agent handoff
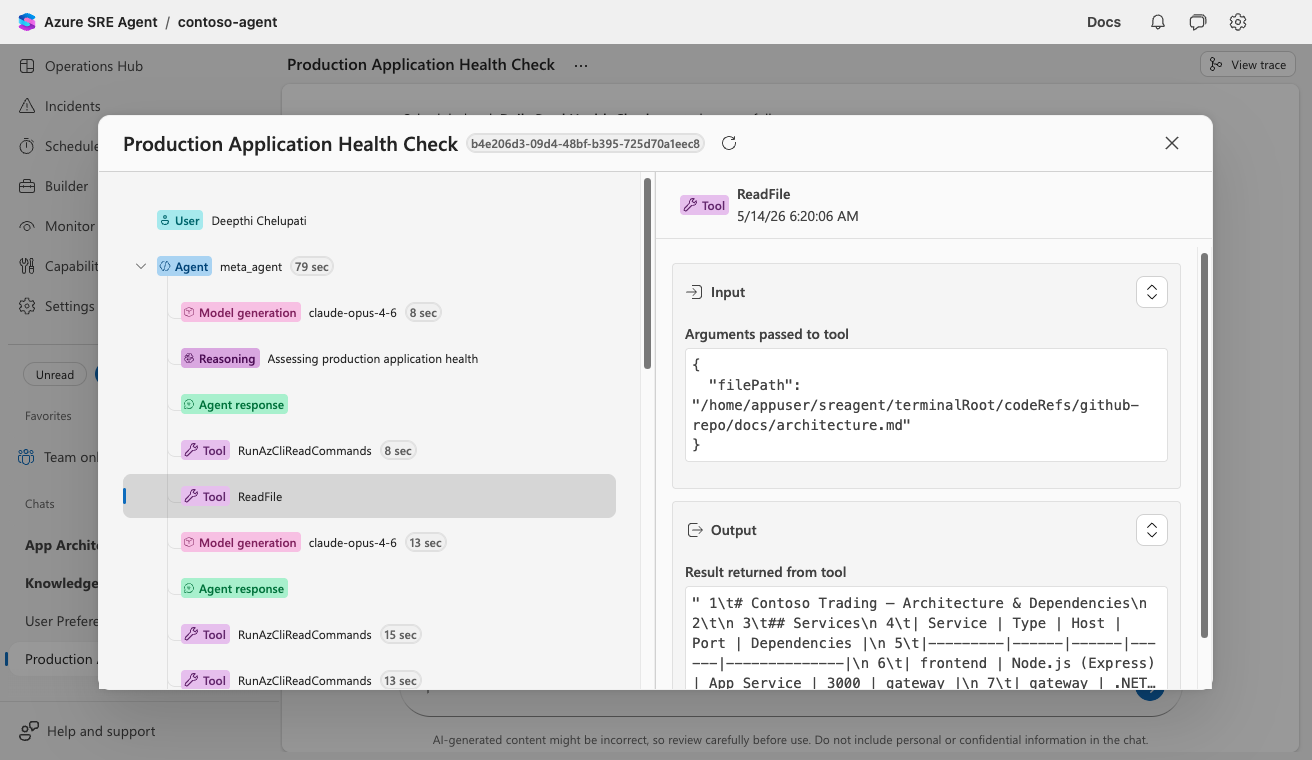
- Traces show timing, inputs, outputs, and thinking steps in a navigable tree view
- Available from any thread via the View trace button
The problem: your agent is a black box
Your agent runs investigations, calls tools, queries logs, and produces answers — but when something goes wrong, you can't see why. Did it use the right tool? Did it misinterpret the results? Did it skip a step?
Without visibility into agent reasoning, debugging agent behavior means guessing. When your agent gives an incorrect answer or takes an unexpected path, you have no way to trace the decision chain and identify where it went off track.
How traces work
Every time your agent processes a message, it generates a trace — a structured record of every step it took. Debug Trace presents this as an interactive tree you can explore.
Opening a trace
Select View trace in the thread title bar to open the trace panel.
The View trace button appears in three locations:
- Thread title bar — Open any thread and select View trace in the top-right corner
- Incidents overview — Select an incident to see its thread, then select View trace
- Response plan view — Open a response plan's thread panel and select View trace
Clicking the button opens a split-panel dialog with a tree view on the left and details on the right.
What you see in a trace
The trace panel displays a tree of spans on the left — each span represents a step your agent performed. Select any span to view its full details on the right, including tool inputs, outputs, and timing.
Each trace contains these span types:
| Span type | What it shows |
|---|---|
| Agent | Agent execution start/end with timing |
| Subagent | Specialized subagent execution (e.g., InitialInvestigationAgent, HypothesisGenerationAgent) |
| Tool | Tool call with name, description, input arguments, output, and duration |
| Model Generation | LLM call with model name, token usage, duration, and model thinking/reasoning content |
| Agent Thinking | Internal reasoning steps |
| Agent Handoff | Transfer to a specialized subagent, with handoff reasoning |
| Agent Handback | Subagent returning control back to the primary agent |
| Agent Response | Final response sent to the user |
| User Message | User input that triggered the action |
| Incident | Root span for incident-triggered threads |
Reading a trace
Traces form a parent-child tree that mirrors your agent's execution flow:
- Root span — The conversation or incident that started the thread
- Agent spans — Your agent planning and deciding what to do
- Tool spans (children of agent) — Individual tool calls with inputs and outputs
- Model spans (children of agent) — LLM calls for reasoning and generation
- Handoff spans — Where your agent transferred to a specialized subagent
Each span shows its duration, so you can identify bottlenecks — for example, a tool call that took 30 seconds versus one that completed in under a second.
Expand any agent or subagent span to see its children — the tool calls, model generations, and handoffs that happened within that step.
Model thinking in traces
When your agent uses a model that produces chain-of-thought reasoning (such as models with adaptive thinking), the reasoning content appears in the Model thinking section of the detail panel for Model generation spans. Select any model generation span and expand Model thinking to see what the model was considering when it decided which tools to call or how to respond.
This reasoning content is also emitted as an OpenTelemetry span attribute (output.reasoning) and logged to the ModelThinking field in customEvents, making it queryable with KQL. See Audit Agent Actions for query examples.
Trace data is stored in your agent's Application Insights customEvents table. When you open the trace panel, it queries this table using KQL, then builds the span tree from the results.
Example: debug a slow investigation
Your agent took 2 minutes to answer a resource health question. To find out why:
- Open the thread and select View trace
- Scan the tree — each span shows its duration
- You spot a Tool span for
SearchResourcethat took 45 seconds — much longer than other calls - Select that span to see the tool input and output
- The input shows a broad query with no filters — your agent searched all resources instead of the specific one
- You update your agent's instructions to include the resource ID, and the next query completes in 2 seconds
Without traces, you would have guessed. With traces, the bottleneck was visible in seconds.
Before and after
| Without traces | With traces |
|---|---|
| Agent gives wrong answer — unclear why | See exactly which tool returned bad data |
| Investigation feels slow — can't measure | Duration per span shows which step is the bottleneck |
| Agent skips a step — no way to verify | Tree view shows complete execution path |
| Don't know what the agent "thought" | Model thinking and reasoning visible in detail panel |
| Handoff to subagent failed — no insight | Handoff reasoning shows why the transfer happened |
Availability
Trace data is stored in your agent's Application Insights instance. When you open the trace panel, it queries Application Insights using KQL, then builds the span tree from the results.
If you see this message when opening a trace:
- Verify Application Insights is configured for your agent — trace data requires Application Insights to be connected
- Check that trace logging is enabled — contact your agent administrator if traces are not appearing
- Wait a few minutes — trace data may take 2–5 minutes to appear in Application Insights after a conversation completes
What you need
| Requirement | Details |
|---|---|
| Application Insights | Must be configured for your agent |
Get started
| Resource | What you'll learn |
|---|---|
| See it in action → | Start a conversation with your agent and view the resulting trace |
Related capabilities
| Capability | What it adds |
|---|---|
| Monitor Agent Performance → | Broader usage metrics and session insights |
| Audit Agent Actions → | Security and compliance logging |
| Incident Response → | Traces show the full reasoning trail during incident investigation |